Geo-Targeting By Planning Around Key Communities Served
We help planners analyze their options when planning occurs are single or multiple key communities.
Understanding where target communities fall within a specific coverage area
|
|
|
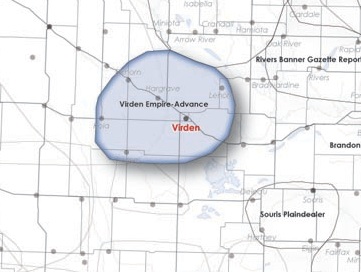
- The agency asked for a recommendation of publication(s) circulating directly to a number of specific communities.
- Using GIS AdCanada Media created a series of maps to highlight the degree of coverage offered by various publications.
- In this case the target community fell within the coverage area of a single publication.
- The map however provided insights into some other newspaper options for consideration by way of outlined, labeled coverage areas and a distance scale.
- Download PDF to view complete example ›
|

|
Multiple target communities and newspaper options mapped
|
|
|
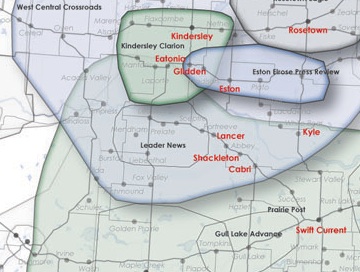
- The agency assumed that a number of their target communities were served by single titles.
- But with no hard evidence to support the assumption they asked that multiple target communities and newspaper options be clearly illustrated.
- Relevant variables were mapped using GIS.
- The communities in this map follow the route of pipeline development and therefore targeted for public awareness campaigns.
- Download PDF to view complete example ›
|

|
Understanding target communities, radius and coverage areas.
|
|
|
- The agency asked AdCanada Media for a recommendation on publications serving key communities in the Edmonton area and a 20km radius around each of them.
- The project scope involved planning around a series of town hall meetings to be marketed to potential attendees.
- The client felt that the audience would be contained within 20km of event location.
- Download PDF to view complete example ›
|

|
Target communities & radius layered against consumer spending density data
|
|
|
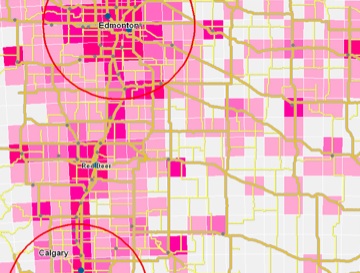
- The agency approached AdCanada Media for a recommendation on newspapers serving less densely populated areas that were more than 150km away from a major metropolitan area.
- Their client, a software manufacturer, also wanted to skew towards markets with spending on computer hardware.
- Using a grid-based density mapping technique, StatsCan consumer spending data (computer hardware) was mapped for the prairies.
- Each square represents an area of 50km by 50km where darker shading = higher spending.
- The agency could easily identify geographic areas for future campaign activity.
- Download PDF to view complete example ›
|

|
Target communities, StatsCan data mapped in thermal density fashion and a distance grid overlay
|
|
|
- A hybrid project involving multiple variables and datasets that ultimately connected back to 'community.'
- AdCanada Media's GIS system was used to layer StatsCan census of agriculture crop production data, mapped in thermal imaging style and incorporating a distance grid (50km by 50km square).
- Client-supplied key communities were added for perspective.
- Download PDF to view complete example ›
|

|


