AdCanada Media iMapper Online Mapping Tool
Use our iMapper to link locations to customers to data to newspapers to new opportunities!
The AdCanada Media iMapper is a tool that combines Google Mapping technology and our existing GIS infrastructure to help media planners assess the relationship between their target and the physical coverage areas of community newspapers.
The application can be used to plot addresses, postal codes, towns etc. and analyze those locations against variables such as: newspaper coverage areas, a user-defined radius or trade area around the target location, topography and much more.
The iMapper also uses thermal imagery to incorporate layers of StatsCan Census and Generation 5 Consumer Spending data to layer the incidence of data as 'hot spots' for added perspective and clarity.

Icons Summary
Please take a few minutes to familiarize yourself with the navigation of the application and how to use the various tools in the control panel along the top.
Please note, that the iMapper is a tool that was designed to analyze the interaction of the key geographic variables that impact the media planning process. It is not intended for use as a simple search tool. For this type of research please visit the Coverage Maps section of this website › |
|

- Note: The AdCanada Media iMapper tool opens in a new window.
|
|

|
Search
Use this function to locate an address, postal code, FSA or town on the map. The map will zoom to the location and place a pushpin on the target location.
|
|

|
Draw Polygon
Use the polygon tool to draw a shape on the map to represent the geogprahic target you wish to measure against applicable newspaper coverage areas. Dealer territories, districts, trade areas, electoral ridings and commuter basins are good examples of the ways to use this tool.
USER HINT: Reference the distance scale in the bottom left hand corner to help create a realistic size for your polygon.
|
|

|
Draw Circle
Use the circle tool to draw a radius on the map to build a basin around your target location. After a few more steps you will be able to clearly see how applicable coverage areas interact with that target basin.
USER HINT: Multiple radius circles can be added to the same map for added evaluation.
|
|

|
Add Text
Use the Add Text tool to add labels to your map customizations. Add a store name to your plotted address or give a name to your radius. Simply click on the text icon and then click the location on the map where you want your text to appear.
USER HINT: The label will appear on the map in the exact location you pinpoint.
|
|

|
Edit
Use the Edit tool to revise your map customizations. For example you can change the size of your circle or polygon by clicking on the edit icon and then clicking on the polygon or circle that you wish to modify.
USER HINT: If you are unhappy with your edit you can click the pop-up back arrow to restore your original shape. The edit icon will not allow you to delete a shape.
|
|

|
Eraser
Use the Eraser tool to delete your map customizations (plots, circles, polygons and test) and start over again.
USER HINT: This cannot be undone.
|
|

|
Add Layers
Use the Layers tool to incorporate other data into your map. Click the layers icon to open up the panel that will appear on the left. The panel can be moved by clicking on the banner and dragging it to a more suitable location on your screen. Check an association name and 'Apply' to add all newspaper coverage areas to the map or narrow your focus by drilling a little deeper into the Zones or Newspapers folders by clicking the ' ' symbol. Canada Post urban FSA's and over two dozen fields of census data can also be added as 'layers.'
USER HINT: It helps to have a general idea of where each newspaper is located before delving into the layers. 'Zone' names are fairly intuitive and can help narrow the focus.
|
|

|
Add Objects
Use the Objects tool to select, view, edit and filter objects within a Layer and set Label mode. For example you have identified publications in the SK Northwest Zone and you wish to remove some of the coverage areas of your map. Individual items within the layer are the Objects.
USER HINT: At this point you should start to see how the iMapper can be effectively used in conjunction with your map customizations to visualize the potential represented by various publications.
|
|

|
Info
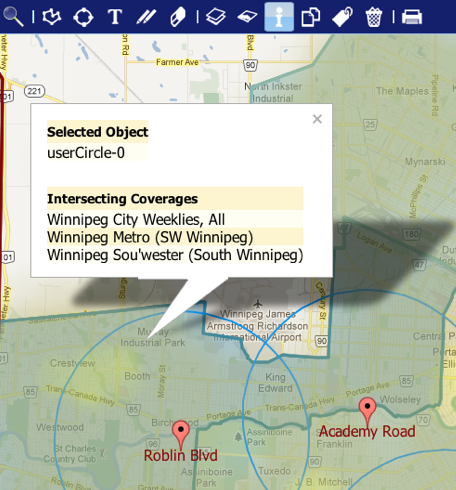
Use the Info tool to select and highlight individual Objects on the map. Click the info icon and then a point on the map to view the Objects beneath it. For example you might want to click on an area of the map that appears to have multiple circulation areas overlapping. The Info tool will tell you what those publications are.
USER HINT: You can label the publication on the map by clicking the name of the newspaper in the pop-up Info box that appears on your map.
|
|

|
Contains
Use the Contains tool to highlight the interaction of Objects (including custom shapes) by clicking a point(s) on the map’ For example you would like to see how many coverages areas overlap against a specific newspaper or what publications circulate within the radius you've built around a postal code. To use this tool simply click the Contains icon and then your point of interest on the map.
USER HINT: The data on the map users layers. When you click on the map your Selected Object will always be the top layer with other objects highlighted against it. To change the Selected Object click the Info icon and then the same point on the map. Change your top layer by clicking on the appropriate publication. Now use the Contains tool to see how objects measure against the new Selected Object.
|
|

|
Add Labels
Use the Labels tool to add a label to any of the Objects on your map. Click the coverage area you wish to label and then click on the newspaper name in the pop-up. Labels can only be added in areas with an active object. Note that when your map contains both Newspaper Coverage Area and FSA layers, you will need to tell the iMapper which you one you want to label. You can switch back and forth between Label Modes by using the Objects tool.
USER HINT: The position of the label is determined by the user. In order to create a map for presentation purposes you may need to modify the scale of the map or the view using the standard Google tools. Once you've added labels to your map you may want to take a screenshot of it to be used for future reference or client presentation purposes.
|
|

|
Trash
Use the Trash tool to delete Layers, Objects and Labels from your map.
USER HINT: This cannot be undone.
|
|

|
Print Mode
Click the printer icon to switch into ‘Print Mode’ and add headings, logos and other valuable information to your map. Once you’ve added your information to the title bar you can print the map using the browsers print function or save the image as a .pdf file for electronic transfer.
USER HINT: If you would like to incorporate a company logo or wordmark into the title bar, first paste the image into a Word or Excel document and Copy/Paste from there.
|


